How Mexico City is drawn from data
BY CDMX ISOMÉTRICO · PUBLISHED NOVEMBER 4, 2026
Every building on this map of Mexico City is drawn from data. No AI model was asked to draw the city: a program reads the information for each building and turns it into pixels following its own rules. This is how it works, and what it makes possible.
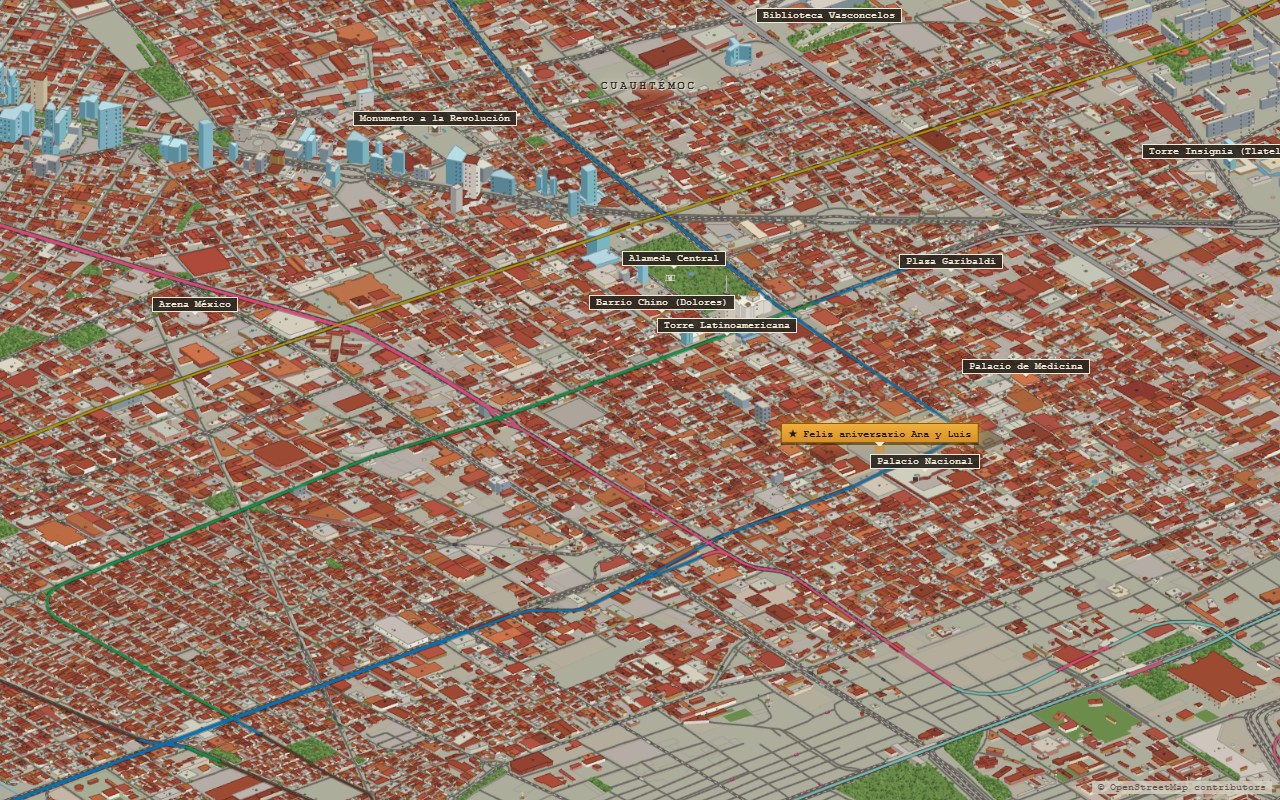
From data to drawing
Everything starts with OpenStreetMap, the open map built by a community of volunteers around the world. For each building, that data says where it is, what shape its outline has and, when someone recorded it, how many floors or meters tall it is. A program reads that data and turns it into volumes seen in isometric perspective, the one used by classic city-building video games.
The program works with fixed rules: what color a rooftop is painted, how a pitched roof is drawn, what height to give a building that has none recorded, where a tree can go. If two buildings have the same data, they are drawn the same way.
How the city is put together
There are three steps. First, the OpenStreetMap data for each zone of the city is downloaded: buildings, streets, parks, water, stations, neighborhood names. Then a program that runs in the browser, which in this project is called the baker, turns all of it into one huge drawing. Finally, the drawing is cut into thousands of small images at several zoom levels, so the map loads quickly even though the whole city is enormous.
When you look at the map from far away, only a few low-resolution images load. As you zoom in, the viewer requests more detailed ones, only for the area on screen. It is the same principle as any online map, applied to a drawing.
An unexpected limit: the number of files
A map like this has constraints that have nothing to do with drawing. The site is hosted on a service that allows a maximum of 20,000 files, and the map already uses more than seventeen thousand images across several zoom levels. Every new zone of the city costs hundreds of files.
That is why the map covers the urban area of Mexico City and not its whole territory. To decide which zones made it in, the number of buildings per square kilometer was measured for each one: where there were few, such as hills, ravines or the rural south, many files would be spent drawing almost nothing. The zones left out were not forgotten; the available space was saved for where the city is.
What is data and what is decoration
Not everything on the map comes from the data, and it is worth saying so. Street trees, cars and the trajineras, the colorful boats on the canals of Xochimilco, are placed by rules to bring the scene to life, not because each one is recorded. The same goes for the height of buildings that have none on record: the program gives them a reasonable one based on their size.
Knowing what is data and what is decoration helps you read the map: a building that is drawn exists in OpenStreetMap; a car parked in front of it, not necessarily.
What it makes possible: counting the city
Because the drawing comes from a database, every pixel has information behind it that can be queried. That makes it possible to ask the map questions and get answers in numbers.
That is how the figures in this site's articles were calculated: that of the 126,885 buildings on the map only 23 are 150 meters tall or more, that there are about fifty different streets named Benito Juárez, or that the densest square kilometer is in the Moctezuma neighborhood, next to the airport. Those articles are in Spanish; your browser can translate them.
What it makes possible: fixing the map
The other advantage is that the map improves when the data improves. If someone traces a missing building in OpenStreetMap or fixes a height, running the program again is enough for it to appear correctly.
It has a cost too: the map only knows what has been recorded. In some neighborhoods the community has traced house by house; in others, almost no buildings are mapped. In those areas the drawing looks emptier than reality, and the way to fix it is for someone to add those buildings to OpenStreetMap.
A community of pixel-art cities
This map is part of the tiny.london world directory, the collection of cities drawn in isometric pixel art that Boris Starkov keeps alongside his map of London, each one made, as the page says, by someone who wanted one of their own city. Thank you for including Mexico City. It is well worth exploring to see how other people solved the same challenge in their cities.
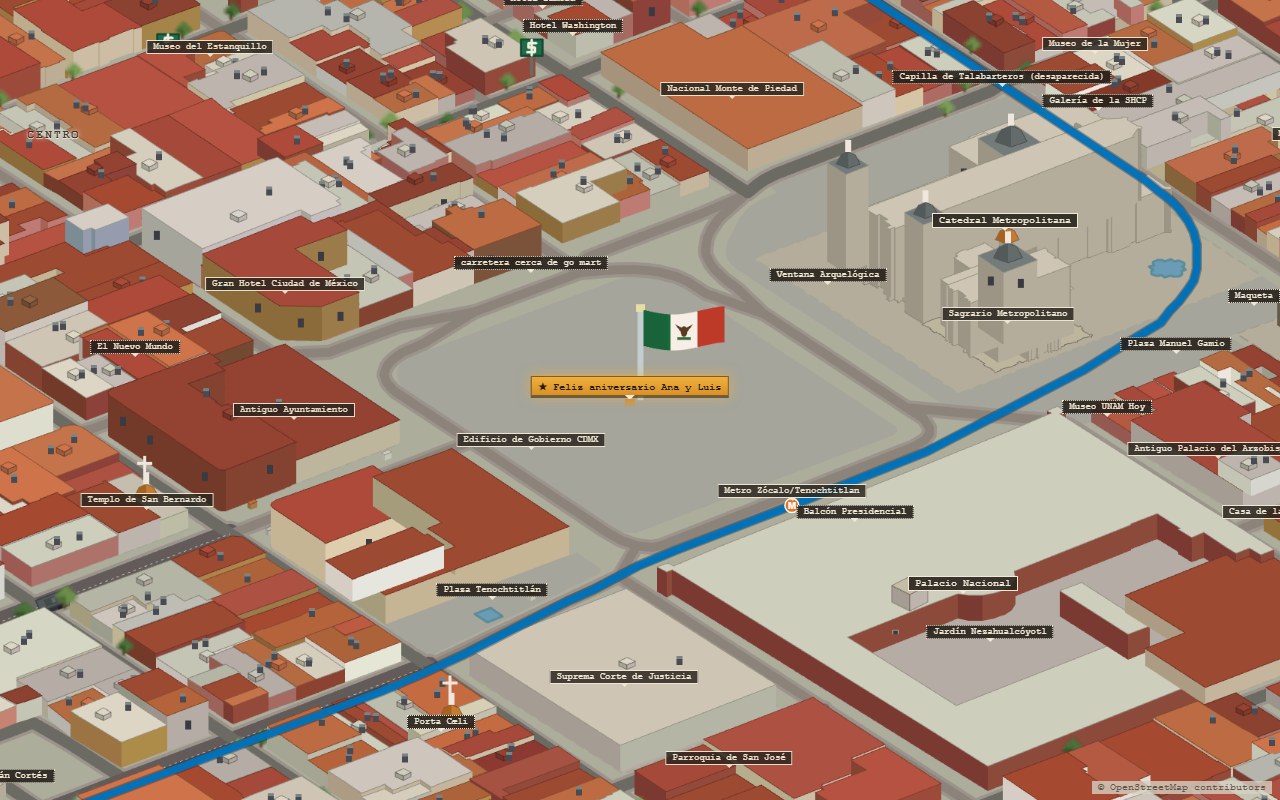
How to see it on the map
- What is data. Zoom into any neighborhood: every building outline you see exists in OpenStreetMap.
- What is decoration. Look at the street trees and the cars: they are placed by rules, not one by one.
- The full story, with its numbers and its setbacks, is in Cómo se hizo el mapa (in Spanish).
Open the map of Mexico CityWhere these numbers come from. Building, street and neighborhood data are from OpenStreetMap, downloaded in August 2026 to draw this map. Data © OpenStreetMap contributors, under the ODbL license.